|
Corresponding author: Pavel V. Shalaev ( shalaev.pv@gmail.com ) © 2021 Pavel V. Shalaev, Polina A. Monakhova, Sergey A. Tereshchenko.
This is an open access article distributed under the terms of the Creative Commons Attribution License (CC BY 4.0), which permits unrestricted use, distribution, and reproduction in any medium, provided the original author and source are credited.
Citation:
Shalaev PV, Monakhova PA, Tereshchenko SA (2021) Study of colloidal gold nanorods in liquid dispersions using light scattering methods. Modern Electronic Materials 7(2): 53-61. https://doi.org/10.3897/j.moem.7.2.75519
|
Abstract
Five samples of liquid dispersions of colloidal gold nanorods having various aspect ratios have been studied using light scattering methods. Transmission electron microscopy has been employed as a reference method. Advantages and drawbacks of dynamic light scattering and nanoparticle tracking analysis methods for study of nanoparticle geometrical parameters and concentration, sample monodispersity degree and detection of large particle aggregations and quasispherical impurities have been demonstrated. We show that depolarized dynamic light scattering method can be used for analysis of geometrical parameters of colloidal gold nanorods in liquid dispersions. The measurement results depend largely on the presence of large impurity particles or particle aggregations in samples. In turn the presence of large particles in dispersions can be detected using dynamic light scattering methods or nanoparticle tracking analysis. Dynamic light scattering method is more sensitive to the presence of even small quantities of large impurities or aggregations in samples. The monodispersity degree of nanorod liquid dispersions can also be assessed using dynamic light scattering and nanoparticle tracking analysis methods, and the measurement results can be considered more statistically significant in comparison with electron microscopy because a larger number of particles are analyzed. An increase in the concentration of spherical particles in compound dispersions of colloidal gold nanospheres and nanorods leads to a decrease in the contribution of the rotational mode to the overall scattering intensity. Data on the concentration of quasispherical impurities in samples of colloidal gold nanorod liquid dispersions have been reported on the basis of scattered light depolarization degree measurements.
Keywords
non-spherical nanoparticles, nanorods, colloidal gold, dynamic light scattering, nanoparticle tracking analysis, light depolarization
1. Introduction
The rapid development of science and technology leads to the emergence of new nanomaterials and their application domains. For example, gold nanoparticles find increasingly extensive use in electronics, biology and medicine thanks to their unique optical, catalytic and ferromagnetic properties. Of special interest are non-spherical nanoparticles such as nanorods because the optical properties of these particles are determined by plasmon oscillations of electrons in the metal and can be controlled by varying their geometrical parameters [
Gold nanoparticles by analogy with other noble metals exhibit plasmon oscillations of electrons in the vicinity of the surface. Thus these particles can retain resonance photons and hence generate coherent surface plasmon oscillations of electrons in the conduction band. Excitation of a surface plasmon by an external electromagnetic wave at the plasmon resonance frequency (localized surface plasmon resonance) leads to an abrupt increase in the extinction cross-section [
The use of one-dimensional nanostructures such as nanorods in electronics and optoelectronics provides for a significant improvement of the physical parameters of devices, increases their working speed, reduces power consumption and delivers economic advantage. They can be used for the fabrication of field effect transistors, diodes, ultraviolet receivers, chemical sensors and nanolasers [
Another promising trend in the use of gold nanorods are photoelectric power converters [
Another recently suggested application of these nanoparticles are high-density optical disks for data storage. In optical disk fabrication process, gold nanoparticles having various aspect ratios are deposited onto a silicon substrate by high intensity pulse laser radiation. Intense laser irradiation leads to deformation of some particles as a result of their melting and fragmentation. Data are recorded by varying radiation parameters and combining particles having various aspect ratios. This possibility is favored by the fact that this deformation of particles requires the irradiating laser wavelength be coincident with the plasmon resonance peak of the nanorods. This technology allows increasing the capacity of optical data storage [
Gold nanoparticles are chemically stable, biocompatible with living tissues and non-toxic, by analogy with gold. These properties in combination with the optical properties of gold nanorods find applications in tumor diagnostics and therapy [
The accuracy of nanoparticle dimension determination is another important factor for biomedicine. If nanoparticle parameters are assessed correctly, large nanoparticles will not be able to penetrate into healthy vasculature unlike particles sized about 1 nm. Correctly designed nanoparticles sized 10 to 100 nm having slightly negative or positive surface charge can penetrate into tumors upon injection in blood circulatory system. This gives a wide range of opportunities for nanoparticle therapeutic applications [
Plasmon resonance photothermal therapy proves to be an effective and promising laser therapy method in which nanoparticles are heated for tumor tissue destruction. It is gold nanoparticles that are most often used in this method of carcinogenic disease therapy because they readily absorb radiation energy and convert it to heat. It was reported that 28 × 8 nm2 gold nanorods are very effective for plasmon photothermal heat release [
Determination of nanoparticle geometrical parameters becomes an important task because of the wide application range of non-spherical nanoparticles.
Currently the key method of determining the geometrical parameters of nanoparticles is electron microscopy. Its high resolution allows visualization of subnanometer sized nanoparticles and characterization of their dimensions and shape as well as study of complex nanoparticle structures.
However the use of electron microscopy for analysis of liquid nanoparticle dispersions has a number of drawbacks the main one of which is that the results of analysis depend largely on the method and conditions of sample preparation (for example, this method cannot show whether particle aggregation took place in the initial suspension or during sample drying on the substrate). Further drawbacks of electron microscopy are lack of information on particle concentration and high cost of analysis.
Light scattering methods allow analyzing nanoparticles in colloidal form without sample preparation and are therefore the most convenient for fast analysis, e.g. in industrial processes, and for studying of different processes in liquid nanoparticle dispersions dynamically (particle aggregation, various chemical reactions, phase transitions etc.).
However existing instruments provide particle size information on the basis of particle spherical shape assumption. Retrieval of information on the geometrical parameters of non-spherical nanoparticles on the basis of analysis of scattered light parameters is a more complex task and is currently at a research stage.
2. Experimental
We studied five samples of colloidal god nanorod water dispersions synthesized by selective etching [
Preliminarily the dimensions of the test samples were measured using transmission electron microscopy (TEM) under a FEI Tecnai G2 transmission electron microscope (FEI Company, US). The acceleration voltage of the microscope was 200 kV. In order to obtain statistically significant results at least 10 micrographs of each sample were made at different magnifications.
The TEM images were automatically analyzed with the ImageJ software (NIH, US). Discrete particles were identified based on threshold brightness in the image. Analysis was carried out with allowance for particle shapes and separately taking into account the number and dimensions of quasispherical particles in the samples. The nanorod samples were studied using several light scattering methods.
The dynamic light scattering (DLS) method allows measurement of the diffusion coefficient and hence the hydrodynamic radius of nanoparticles in liquid dispersions by analyzing the autocorrelation function (ACF) of scattered light intensity.
The DLS measurements were carried out on a Photocor Complex particle size analyzer (Photocor Ltd., Russia). The samples were irradiated with a 657 nm laser. The study was carried out at 23 °C. Calculation of the hydrodynamic radius of particles was based on water viscosity at the experimental temperature (0.9 cP) and a 1.332 media refraction index. The ACF was measured for a 90 arc deg scattering angle, the ACF acquisition time being 30 s. At least 10 measurements were made for each sample.
For the classical DLS method the nanoparticle size information is obtained in the assumption of spherical nanoparticle shape. Therefore if the nanoparticles in question are non-spherical, e.g. nanorods, the measurement and analysis using the instrument’s pre-installed software do not provide information on the geometrical parameters of the particles. However there is an approach for the analysis of the geometrical parameters of cylindrical particles on the basis of the modified DLS method for which the rotational diffusion of non-spherical particles is additionally measured, i.e., the depolarized dynamic light scattering method (DDLS) [
For the DDLS method the vertically (VV) and horizontally (VH) polarized components of scattered light intensity are recorded. The ACF of the scattered light VH component allows assessing the rotational diffusion coefficient of non-spherical particles and then to calculate on its basis the geometrical parameters of the non-spherical particles [
The DDLS measurements of colloidal gold nanorod samples were also conducted using the Photocor Complex analyzer which was additionally equipped with an automatic polarizer. Further analysis of the obtained scattered light intensity distributions by correlation time was carried out using the Tirado and Garcia De La Torre model [
Another applicable method of studying liquid dispersions of cylindrical nanoparticles is measurement of the depolarization degree for scattered laser radiation. In this work the relative concentrations of quasispherical impurities in the test samples were measured using the earlier developed model describing the dependence of laser radiation depolarization degree for scattering in liquid dispersions of cylindrical nanoparticles on the mean aspect ratio of the nanoparticles [
The samples were also studied using the nanoparticle tracking analysis method (NTA). For this method nanoparticles are visualized in liquid media by means of laser beam irradiation and light scattering detection for discrete particles with a microlens video camera. During analysis the Brownian movement of particles in the test liquid is video recorded and then software processed. Based on analysis of discrete particle tracks the diffusion coefficient of the particles is calculated and then recalculated to the hydrodynamic radius using the Stokes-Einstein relation.
The NTA measurements were carried out with a Photocor Nanotrack nanoparticle tracking analyzer (Photocor Ltd., Russia). The samples were irradiated with a 405 nm laser, the measurement time being 30 s. The shutter speed and amplifications were chosen individually for each sample in order to obtain the optimum signal-to-noise ratio in the particle Brownian movement video records. At least ten measurements were made for each sample. Since excessive particle concentrations complicate analysis of Brownian movement video files for nanoparticle tracking analysis, the samples were diluted with distilled water before the measurements.
By analogy with DLS, information on particle dimensions is obtained in the NTA method based on spherical particle shape assumption. Therefore this method does not provide accurate information on the dimensions of cylindrical particles. Nevertheless it will be shown below that NTA study of colloidal gold nanorod liquid dispersion samples leads to a number of valuable conclusions on various sample parameters, e.g. the presence of large impurities or particle aggregations, monodispersity degree and particle concentration.
3. Results and discussion
3.1. Geometrical parameters
Of greatest interest in the study of nanoparticle liquid dispersions are their geometrical parameters, e.g. dimensions and particle shape.
The geometrical parameters of the particles in the test samples were determined on the basis of the micrographs obtained by transmission electron microscopy (Fig.

(a) Fragment of TEM micrograph for Sample No. 3 and (b) particle distribution in sample by aspect ratio obtained from analysis of the micrograph.
One drawback of the method is that the number of particles that can be identified in the microscopical images obtained is typically on the order of several hundred, whereas one milliliter of colloidal liquid can contain several billions of particles. One should therefore bear in mind that analysis of measurement results obtained using electronic microscopy methods implies generalization of the data obtained from a study of small sampling, for the whole sample.
Also known is an approach that allows determining the aspect ratio of nanorods by measuring the depolarization degree of laser radiation in liquid dispersions [
Analysis of the ACF for VV and VH polarization yielded characteristic correlation times related to the translational and rotational diffusion of nanoparticles (the translational and rotational modes). For most of the measurements the resultant correlation time distributions exhibited two peaks for VV polarization and one peak for VH polarization (Fig.

Correlation time distributions for Sample No. 5 for (a) VV polarization and (b) VH polarization.
Since it is well-known that the characteristic correlation time of VV polarization is determined by the translational and rotational diffusion of nanoparticles whereas for VH polarization it only depends on the rotational diffusion of nanoparticles, comparison of the experimental distributions allowed definitive identification of the translational and rotational modes on the basis of which the translational and rotational diffusion coefficients of nanoparticles were calculated.
It should be noted that the correlation times of the translational and rotational modes differed considerably between the specimens (by two orders of magnitude for nanorods with an aspect ratio of 2 and by one order of magnitude for nanorods with an aspect ratio of 6). Taking this fact into account one can conclude that given preliminary information on the geometrical parameters of the particles studied (for example, if the range of possible aspect ratios for the test nanorod samples is known), VH polarization measurements are not required.
Comparison of polarization measurement results with TEM image analysis results are shown in Fig.
The experimental results show that the DDLS data for Samples Nos. 3, 4 and 5 are in quite a good agreement with the TEM data whereas for Samples Nos. 2 and 6 these data disagree. This can be accounted for as follows.

The values of length (a), width (b) and aspect ratio (c) measured by DDLS and TEM methods.
For Sample No. 2 with an aspect ratio of ~2 the error of determination of the geometrical parameters probably originates from the fact that the model used is applicable to cylindrical particles with aspect ratios of 2 to 20 [
However for Sample No. 6 the discrepancy between the polarization data and the TEM data can be accounted for by specific features of the nanoparticle liquid dispersion sample which is more susceptible to aggregation compared with the other test samples. This assumption will be further confirmed by DLS and NTA measurements.
3.2. Presence of large impurities or particle aggregations
Although the classical DLS and NTA methods are inapplicable to analysis of the geometrical parameters of non-spherical nanoparticles, study of nanorod liquid dispersion samples with these methods allows making some conclusions concerning other important parameters, e.g. presence of large impurities or particle aggregations in samples.
DLS and NTA studies of Samples Nos. 2–6 showed that the size distribution of particles in Sample No. 6 exhibits peaks near sizes of several decades of microns which can testify to its contamination with extrinsic particles or the presence of particle aggregations in the sample.
As a result of ultrasonic treatment for 10 min at 22 kHz and a power of 75 W the peak corresponding to large particles became quite small as shown by repeated measurement, confirming the assumption that the particles in Sample No. 6 are susceptible to aggregation during long-term storage.
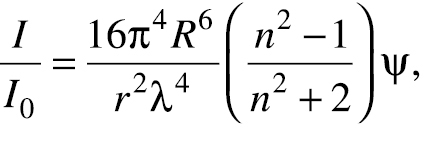
The studies carried out in this work have led to the conclusion that the DLS method is more sensitive to the presence of large impurities or nanoparticle aggregations in nanoparticle liquid dispersion samples than the NTA method. This is accounted for by the fact that for the DLS method the radiation recorded is scattered simultaneously by a large number of particles. However the light scattering theory postulates the well-known formula of Rayleigh scattering for small particles of the radius R with the refraction index n1 in liquid media with the refraction index n2:
 (1)
(1)
where λ is the wavelength of the incident light beam; n is the relation of the refraction indices (n2/n1); I0 is the intensity of the incident radiation; I is the intensity of the scattered radiation; r is the distance between the scattering region and the observation point; ψ is the angle between the polarization direction of the incident wave and the scattering direction. It can be seen from Eq. (1) that the intensity of the scattered light is determined by the sixth power of the radius of the particle. Thus for DLS analysis of samples of differently sized nanoparticles the contribution of large particles to scattered light intensity will be much greater. For this reason the DLS method allows detecting even small concentrations of large particles in liquid dispersion samples.
The NTA method also allows detecting the presence of large particles in samples but due to the fact that the number of particles analyzed during one measurement is smaller in comparison with that for the DLS method, NTA is less sensitive to the presence of large particles in samples. However it is quite difficult to analyze a sample of nanoparticle liquid dispersion for the presence of particle aggregations using TEM because the results of analysis depend largely on the method and conditions of sample preparation. It is usually impossible to find out whether aggregation took place in the initial suspension or during sample drying on the substrate.
3.3. Monodispersity degree
An important parameter of nanoparticle liquid dispersions is their monodispersity degree.
The size scatter of particles in the samples was initially assessed based on analysis of TEM images. It was shown that the test samples can be considered monodisperse with relative deviations of 8–15% in length and 7–12% in diameter. One should however bear in mind that analysis of TEM images covers only a small number of particles.
DLS and NTA methods were used for a more statistically significant assessment of the monodispersity degree for the test samples. Although both methods provide the calculation of the hydrodynamic radius of particles in the approximation of spherical particles, the monodispersity degree of the sample can be assessed based on the halfwidth of the particle size distribution peak. And, which is especially the case for the DLS method, the result is based on analysis of a significantly large number of particles.
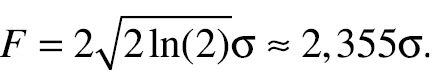
Since particle concentration distributions for NTA and the scattered light intensity distributions for DLS have close to normal shapes, one can establish a correlation between the peak halfwidth F determined using these methods and the dispersion s2 as follows:
 (2)
(2)
Figure

A mixture of Samples Nos. 2 and 3 was also studied using DLS and NTA. The relative deviations were 27.3% for DLS and 34.5% for NTA.
Thus it was shown that DLS and NTA measurements allow one to determine the monodispersity degree of nanorod liquid dispersions which can be useful for example in assessing the quality of synthesized nanoparticle samples, evaluation of the condition of liquid dispersion samples after long-term storage etc.
3.4. Presence of quasispherical impurities
For particles like colloidal gold nanorods, liquid dispersion samples may contain, along with cylindrical particles, a certain quantity of quasispherical particles (Fig.
In many practical applications of colloidal gold nanorods and for overall quality evaluation of synthesized nanoparticle samples it is important to have information on the presence and concentration of quasispherical impurities in the sample.
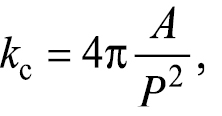
The quantity of quasispherical impurities can be evaluated by analyzing TEM images. Automatic image analysis for the test nanorod samples identified quasispherical impurities by the parameter of circularity kc:
 (3)
(3)
where A is the area of a particle and P is its outer boundary length as seen in the image. Thus kc = 1 for a perfect circle while kc close to zero is the case for elongated particles.
Analysis showed that the quantity of impurities in the samples is within 10% (Fig.
Obviously impurity concentration evaluation based on TEM data is relatively rough because it implies generalization of the data obtained from a study of small sampling, for the whole sample.

Scattered light intensity distributions for (a) dispersion of nanorods, (b) compound diospersion of nanorods and nanospheres and (c) dispersion of nanospheres.
Samples of dispersions containing mixtures of spherical and non-spherical particles were studied with light scattering methods.
DLS and NTA studies allow one to discern nanorods and quasispherical impurities in the experimental distributions only if the dimensions of impurity particles differ significantly from those of nanorods. Otherwise the resolution of the methods proves to be insufficient for differentiating between particles of various shapes but close sizes. This is especially the case for DLS which allows one to reliably discern fraction dimensions in a polydisperse system only if the particle sizes differ by 2 or more times. If the dimensions of impurity particle are comparable with those of nanorods, discerning them using this method is quite a complex task.
However the experiments carried out in this work showed that DLS data can be used for retrieving information on the concentration of quasispherical impurities in a dispersion of cylindrical particles on the basis of their contributions to the scattering intensity of rotational and translational modes.
Analysis of scattered light intensity distributions for the compound dispersion of colloidal gold nanorods (Sample No. 3, average length 51 nm, average diameter 17 nm, aspect ratio 3) and colloidal gold nanospheres 90 nm in diameter suggests that with an increase in the concentrations of nanospheres in a compound dispersion the contribution of the rotational mode to the overall scattering intensity decreases.
It can be seen from Fig.

Relative concentration of quasispherical impurities as per depolarization degree and TEM measurements.
The small rotational mode peak in the scattering intensity distribution for the nanosphere dispersion (Fig.
It can be seen from the scattering intensity distributions shown in Fig.
It was found that the dependence of the ratio of the rotational and translational mode contributions to the scattering intensity on the concentration of spherical particles in the mixture is linear. Thus, provided initial calibration is done, the approach based on measurement of this ratio can be used for evaluation of the concentration of quasispherical particles in nanorod liquid dispersion samples. There is also an approach to evaluation of the concentration of quasispherical particles in non-spherical nanoparticle samples that is based on measurement of scattered light depolarization degree.
Using the earlier model describing the dependence of laser light depolarization degree for scattering in liquid dispersion of cylindrical nanoobjects on their average aspect ratio [
It can be seen that the results are in a good agreement with the TEM data. One should however take into account that the approach based on measurement of laser radiation depolarization degree is only applicable if the aspect ratio of nanorods in the test nanorod dispersion is known.
3.5. Particle concentration in liquid dispersion
Particle concentration is an important parameter for a number of practical nanoparticle applications.
Of the methods discussed herein only the NTA method allows sufficiently fast and effective evaluation of the concentration of particles in samples.
The concentration of particles in the test samples was assessed using NTA. It was based on measurement of the number of particles in the scattering volume which is visualized during analysis and is known (it is determined from the geometrical parameters of the laser beam, vision field area and depth of focus of the instrument recording system). The accuracy of the concentration measurements with the instrument was controlled by measuring the reference polystyrene latex nanoparticles with a known concentration.
The measured concentration of particles in the samples was 107 to 109 particles per ml. The measurements showed that since there was a generalization of the data obtained from a study of small sampling, for the whole sample, results of single measurements for one sample may vary significantly, especially for low particle concentrations. Therefore in order to obtain statistically significant concentration measurement results by NTA one should make a number of repeated measurements for each sample.
4. Conclusion
Five samples of liquid dispersions of colloidal gold nanorods having various aspect ratios were studied using light scattering methods, i.e., DLS, DDLS, NTA and depolarization degree measurement. The reference method was TEM.
We demonstrated advantages and drawbacks of the abovementioned methods for the determination of nanoparticle liquid dispersion parameters such as nanoparticle geometrical parameters, monodispersity degree, concentration of particles, presence of large impurities or particle aggregations and presence of quasispherical impurities.
We showed that the DDLS method can be used for the measurement of the geometrical parameters of colloidal gold nanorod liquid dispersions. In comparison with TEM, DDLS measurement results can be obtained in a shorter time without expensive instruments while remaining more statistically significant because a greater number of particles are analyzed. However one should bear in mind when using this method that DDLS measurement results can be appreciably distorted by the presence of large impurity particles or particle aggregations in the sample.
In turn the presence of large particles in dispersion can be detected using the DLS and NTA methods. The DLS method is more sensitive to the presence of even small quantity of large impurities or aggregations. However it is usually impossible to study a sample for the presence of particle aggregations with TEM.
The monodispersity degree of nanorod liquid dispersions can also be successfully evaluated using DLS and NTA and the measurement results can be considered more statistically significant in comparison with TEM because a greater number of particles are analyzed.
The presence and concentration of quasispherical impurities in nanorod liquid dispersion samples can be determined on the basis of DLS data and by measuring scattered light depolarization degree. In the former case a quantitative evaluation requires preliminary calibration with the use of reference particles having known geometrical parameters. In the latter case in order to obtain information on the concentration of quasispherical impurities in test samples one should know the aspect ratios of the nanorods in the test dispersions which can be determined using the DDLS or TEM methods. The results of this work may have practical importance for studies of liquid dispersions of non-spherical particles.
Acknowledgments
This work was accomplished with financial support from the Ministry of Science and Higher Education of the Russian Federation (Agreement No. 14.584.21.0021, Identifier RFMEFI58417X0021).
The Authors express their gratitude to Laboratory Scientist of the Nanobiotechnology Laboratory of the Institute of Biochemistry and Physiology of Plants and Microorganisms of the Russian Academy of Sciences B.N. Khlebtsov for providing the test samples of colloidal gold nanopartices.
References
- 1 Huang X., Neretina S., El-Sayed M. Gold nanorods: from synthesis and propertiesto biological and biomedical applications. Adv. Mater. 2009; 21(48): 4880–4910. https://doi.org/10.1002/adma.200802789
- 2 Khlebtsov N. Optics and biophotonics of nanoparticles with a plasmon resonance. Quantum Electronics. 2008; 38(6): 504–529. (In Russ.). https://doi.org/10.1070/QE2008v038n06ABEH013829
- 3 Lee K.C.J., Chen Y.-H., Lin H.-Y., Cheng C.-C., Chen P.-Y., Wu T.-Y., Shih M.-H., Wei K.-H., Li L.-J., Chang C.-W. Plasmonic gold nanorods coverage influence on enhancement of the photoluminescence of two-dimensional MoS2 monolayer. Sci. Rep. 2015; 5: 16374. https://doi.org/10.1038/srep16374
- 4 Liang Z., Sun J., Jiang Y., Jiang L., Chen X. Plasmonic enhanced optoelectronic devices. Plasmonics. 2014; 9: 859–866. https://doi.org/10.1007/s11468-014-9682-7
- 5 Reiser B., González-García L., Kanelidis I., Maurera J.H.M., Kraus T. Gold nanorods with conjugated polymer ligands: sintering-free conductive inks for printed electronics. Chem. Sci. 2016(7): 4190–4196. https://doi.org/10.1039/c6sc00142d
- 6 Wu B., Liu D., Mubeen S., Chuong T.T., Moskovits M., Stucky G.D. Anisotropic growth of TiO2 onto gold nanorods for plasmon-enhanced hydrogen production from water reduction. J. Am. Chem. Soc. 2016; 138(4): 1114–1117. https://doi.org/10.1021/jacs.5b11341
- 7 Shen G., Chen D. One-dimensional nanostructures for electronic and optoelectronic devices. Front. Optoelectron. China. 2010; 3(2): 125–138. https://doi.org/10.1007/s12200-010-0001-4
- 8 Mahmoud A.Y., Zhang J., Ma D., Izquierdo R., Truong V.-V. Optically-enhanced performance of polymer solar cells with low concentration of gold nanorods in the anodic buffer layer. Organic Electron. 2012; 13(12): 3102–3107. https://doi.org/10.1016/j.orgel.2012.09.015
- 9 Liu C., Zhao C., Zhang X., Guo W., Liu K., Ruan S. Unique gold nanorods embedded active layer enabling strong plasmonic effect to improve the performance of polymer photovoltaic devices. J. Phys. Chem. C. 2016; 120(11): 6198–6205. https://doi.org/10.1021/acs.jpcc.6b00459
- 10 Chon J.W.M., Bullen C., Zijlstra P., Gu M. Spectral encoding on gold nanorods doped in a silica sol-gel matrix and its application to high-density optical data storage. Adv. Funct. Mater. 2007; 17(6): 875–880. https://doi.org/10.1002/adfm.200600565
- 11 Zijlstra P., Chon J., Gu M. Five-dimensional optical recording mediated by surface plasmons in gold nanorods. Nature. 2009; 459: 410–413. https://doi.org/10.1038/nature08053
- 12 Du Y., Jiang Q., Beziere N., Song L., Zhang Q., Peng D., Chi C., Yang X., Guo H., Diot G., Ntziachristos V., Ding B., Tian J. DNA-nanostructure–gold-nanorod hybridsfor enhanced in vivo optoacoustic imaging and photothermal therapy. Adv. Mater. 2016; 28(45): 10000–10007. https://doi.org/10.1002/adma.201601710
- 13 Li Z., Huang H., Tang S., Li Y., Yu X.-F., Wang H., Li P., Sun Z., Zhang H., Liu C., Chu P. K. Small gold nanorods laden macrophagesfor enhanced tumor coverage in photothermal therapy. Biomaterials. 2016; 74: 144–154. https://doi.org/10.1016/j.biomaterials.2015.09.038
- 14 Jain P.K., Lee K.S., El-Sayed I.H., El-Sayed M.A. Calculated absorption and scattering properties of gold nanoparticles of different size, shape, and composition: applications in biological imaging and biomedicine. J. Phys. Chem. B. 2006; 110(14): 7238–7248. https://doi.org/10.1021/jp057170o
- 15 Davis M., Chen Z., Shin D. Nanoparticle therapeutics: an emerging treatment modality for cancer. Nature Rev. Drug Discovery. 2008; 7(9): 771–782. https://doi.org/10.1038/nrd2614
- 16 Mackey M., Ali M., Austin L., Near R., El-Sayed M. The most effective gold nanorod size for plasmonic photothermal therapy: theory and in vitro experiments. J. Phys. Chem. B. 2014; 118(5): 1319–1326. https://doi.org/10.1021/jp409298f
- 17 Khanadeev V., Khlebtsov N., Burov A., Khlebtsov B. Tuning of plasmon resonance of gold nanorods by controlled etching. Colloid Journal. 2015; 77(5): 652–660. https://doi.org/10.1134/S1061933X15050117
- 18 Xu R. Light scattering: A review of particle characterization applications. Particuology. 2014; 18: 11–21. https://doi.org/10.1016/j.partic.2014.05.002
- 19 Lehner D., Lindner H., Glatter O. Determination of the translational and rotational diffusion coefficients of rod-like particles using depolarized dynamic light scattering. Langmuir. 2000; 16(4): 1689–1695. https://doi.org/10.1021/la9910273
- 20 Tirado M., Martínez C., de la Torre J.G. Comparison of theories for the translational and rotational diffusion coefficients of rod-like macromolecules. Application to short DNA fragments. J. Chem. Phys. 1984; 81(4): 2047–2052. https://doi.org/10.1063/1.447827
- 21 Tereshchenko S., Burnaevsky I., Dolgushin S., Shalaev P. Determination of the composition of liquid polydispersions of cylinder-like microorganisms from the laser depolarization degree. Biomedical Engineering. 2017; 50(6): 385–389. https://doi.org/10.1007/s10527-017-9661-3